Showing posts with label Graphing. Show all posts

Friday, 2 November 2012

Pie Charts with Beads

This is a hands on way to teach students about the creation of pie charts. Similar to the activity with sentence strips, this one uses string and beads.


Students in groups were given a set of data and their task was to create a pie chart for it.

The first step was to identify what colour beads we would use for each category. As you can see on our data sheet, we coloured the category the bead colour. 

Next, we began putting on the amount of each category for the beads. One bead = one tally mark.


 This is what our string looked like after putting on the total amount of beads. We made sure that the amount of tally marks on the data set was the same amount of beads we had.
We then attached the end of our strings to create a circle. And ta-da...we had ourselves a pie chart.

Tuesday, 9 October 2012

Creating a Pie Chart with Sentence Strips

Our data...a little blurry from the IWB.
Pie charts... where do I begin? I find them very difficult to teach to children as they often understand and can analyse them, but struggle to create them. 

I tried this idea recently with my maths class for creating a pie chart. We used sentence strips to create a pie chart. For our example, it worked out that we were teaching fractions and graphing simultaneously and so we used data from our "Smarties" fractions activity to create a pie chart to represent that data.

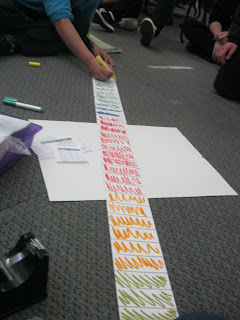
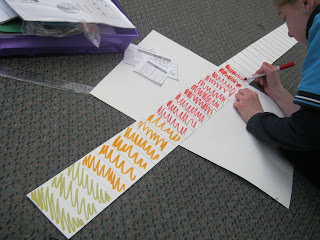
The total number of Smarties was 40, so we began by dividing our sentence strip into 40 even pieces. Each piece was the width of our ruler.

Next, we coloured in the amount of each part of the pie chart. Thus, three pieces of the sentence strip were coloured brown to represent the three brown Smarties, six pieces coloured orange to represent the orange Smarties and so on.

The next step was to create our pie chart by putting the ends of the sentence strip together. The smaller the sentence strip, the easier this is so we had to get a little creative to keep the ends together.
Once the ends were together, we place our circle onto paper to trace our pie chart.
And finally, we used a ruler to create the divisions of the pie chart on our paper. A fun and creative way to create a pie chart! This is also a concrete way of creating pie charts. Following the Concrete-Pictorial-Abstract theory, we then moved on to creating pie charts on paper and then abstractly.


Monday, 1 October 2012

What I Know About...

This was an excellent way to start off our unit on graphing but can be used for basically any topic you would like.

Students formed into a circle and the only material I needed was a soft toss ball. I started by tossing the ball to a random student and they had three seconds to share one thing they knew about graphs. After stating their fact, they toss the ball to the next student and so on. If a student could not state a fact within the three seconds, they sat down. We continued to toss the ball until there were only two students standing up. 

Such a simple concept but the students loved it. As you know, their competitive side often comes out in games in the classroom. We must of come up with over thirty different facts about graphing in this game. 

Next time we play, I will use this to form a class K-W-L chart for the unit. Rather than doing a brainstorm session on the carpet to fill in the "What I Know" section, we will play the game and have a student (or myself) record all the facts stated by the students to then be placed in that section of the K-W-L chart. 

This is also a wonderful EAL strategy to use in a maths classroom. The best way to help students develop their knowledge of the English language is through oral language. We often struggle or forget to focus on vocabulary in maths, thus this game allows students to verbally express their ideas and have exposure to vocabulary specific to the unit in focus. 

Please let me know how you can use this and/or modify it in your classrooms.

Friday, 21 September 2012

Graphing Brainstorm

Here is another example of how to use a progressive brainstorm. This time I used to it introduce different graphs to the students.

Check out my past blog post "Progressive Brainstorm-Fractions" to learn more about how they work. This is a strategy to be used with EAL (English as an Additional Language) students in your class and as you can see, it can easily be used in maths classes also (extra bonus)!


Monday, 3 September 2012

Creating a Bar Graph

Learning Focus: Creating a bar graph from data

During our whole class focus, students spread out into a circle and began to create a large bar graph in the middle of the circle. All the labels for the graph were pre-written by the teacher and students had to take turns placing all the labels onto the graph.
Students had to place the title, labels for the x and y-axis, scale numbers, and categories for the x-axis onto the graph. Then, using the data, they had to create their bar graph by representing the data with concrete materials.
The EAL strategy used is called Matching and Labelling. This activity caters to EAL students in your class as it scaffolds the task for them. Instead of giving students a blank canvas to create a graph, students are given the labels to assist them in beginning to create their graph. This also allows teachers to observe students understanding of how data is displayed on a graph (ex. what information goes on what axis). Also, by allowing students to work in a mixed ability group, EAL students get a chance to observe 5 star work and input their own opinions and ideas without feeling intimidated to get the wrong answer.
Although this was an EAL strategy that I used, all students were focussed and thoroughly enjoyed the activity. This maths activity was SO engaging for the students as they did not want to stop. One student asked if we can do this every day.

After we created a whole class graph, in groups, students went and made their own graph using concrete materials in the room with new data. Here are some of their work samples: